30 Oct 2018
Up to Blog
Feature: Dashboards
JASP is a platform for security automation. We currently focus on monitoring AWS environments for potential security issues.
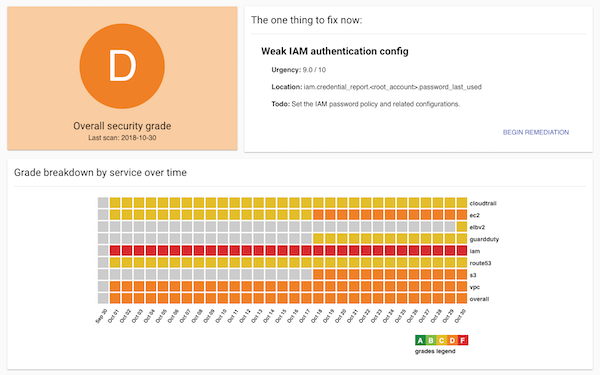
Throughout September and October, we have been refining JASP dashboards. The goal is to give user’s the simplest possible summary view of how they are doing. We wanted to help convey a sense of how a user’s environment stacks up. We found that people want to know not just what their issues are but how they are doing … relative to other companies and relative to where they should be. To do that, we did some number crunching and analysis of typical security issues we find.
To implement this, we drew a bit from SSL Labs Grades and Github contributions.
The goal is to show:
- Roughly how you are doing in simple terms. (Nobody wants a “D”!)
- How we calculated your grade and some history so you can see improvement or quality sliding right there in the dashboard
- Our “The One Thing™” idea - the one thing you should go fix today.
Below is an example from one of the intentionally insecure environments we test with. Note that the services are clickable and drill through to the specific security issues that are causing the grade for the given service.
JASP users should be able to see their dashboards now here. We are adding notifications now to alert users if their grade changes and to ensure that we communicate what their grades are periodically.

Up to Blog